Red-R: A open source visual programming GUI interface for R
Red-R is a open source visual programming interface for R designed to bring the power of the R statistical environment to a broader audience. The goal of this project is to provide access to the massive library of packages in R (and even non-R packages) without any programming expertise. The Red-R framework uses concepts of data-flow programming to make data the center of attention while hiding all the programming complexity.Red-R Journal
The Red-R Journal is now accepting articles for publication. Please submit inqueries to .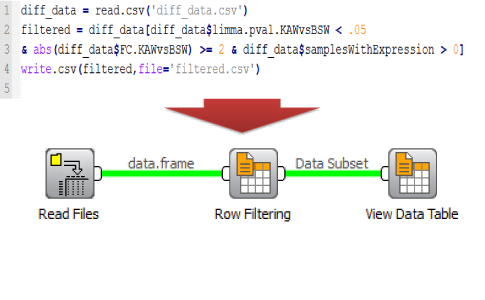
Improve Readability
Red-R uses visual programming to hide the code complexity of R and improve readability. Widgets can read, manipulate or visualize data and link together to create an analysis pipeline. And all the widget parameters are displayed in an easy to use and understand interface.
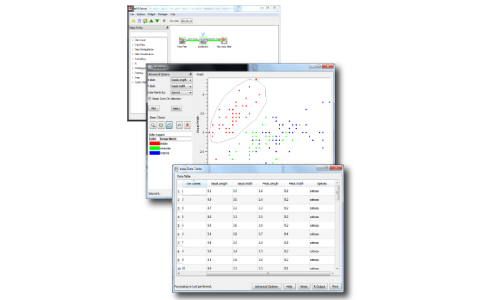
Interactivity
Red-R enables data exploration by providing interactive graphics (zooming, selecting...). In addition changes in analysis parameters are immediately propagated downstream, instantly updating visualization widgets with the new results.
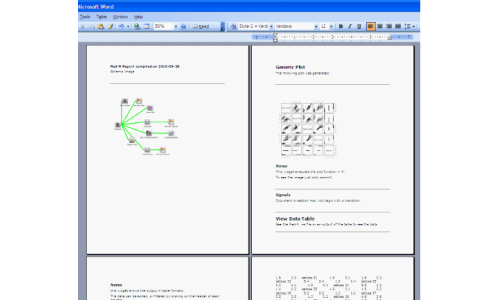
Automated Reports Generation
Easily create printable reports of your Red-R schema. Reports can be generated in odt (Microsoft Word compatible) LaTex (PDF compatible) or HTML format. Reports will contains and overview of the pipeline, key parameters and images/data.
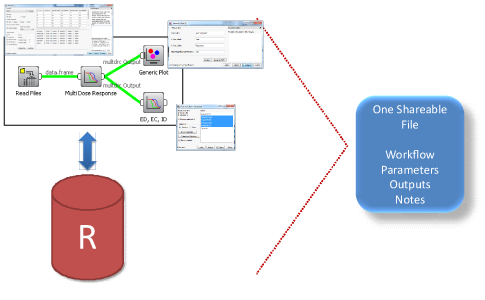
Data Sharing
Improve data and analysis sharing between users. Red-R saves all the data, widget connections, parameters and notes in one file. The saved schema when opened on another computer looks exactly as it was when saved.
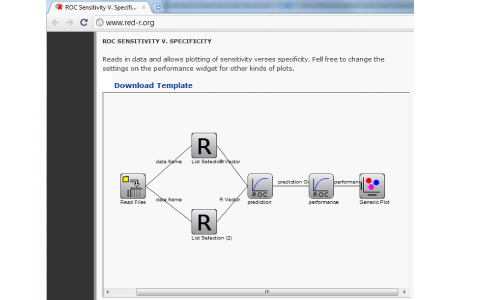
Expert Templates
Red-R templates are analysis pipelines with preset parameters and documentation for common tasks. Experts can share templates with the community to help novices get started with complex analysis.
